John Twitty Energy Center, or JTEC, is one of Springfield, Missouri’s main power supply and is owned and operated by City Utilities of Springfield. It is located on the southwest part of town. It is comprised of four power units, two which burn coal and two that burn natural gas. In total the plant can produce over 600 megawatts of power, the majority of this being from the two coal units. JTEC was first built in 1953, slowly expanding to reach the demands of the now 110,000 customers in Springfield. In more recent times, City Utilities has set its sights on more sustainable energy sources. With the purchase of wind power from Oklahoma and Kansas, both units for coal power generation are not necessary. They will fully shut down one of the units by 2027 in order to favor these more sustainable power sources. For the time being however, the plant has the capacity to burn 87,000 pounds of coal per hour. After seeing the plant in person myself, and seeing how large the operation was and the large pile of reserved coal, I wondered how much coal was in their reserves.
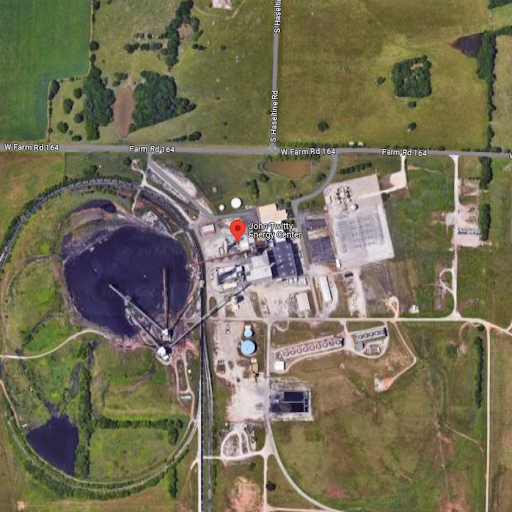
Aerial view of JTEC
The method in which I would estimate how much coal is in this reserve pile involves the use of LiDAR point clouds, Digital Elevation Models, and surface volume analysis. First, I retrieved point cloud data from USGS Lidar Explorer. Using the base map as a reference and generating 3D views I was able to determine the location of the coal pile. It had a significant enough change in elevation where it was easily identifiable and did not require any vertical exaggeration.
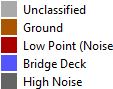
Legend
LiDAR point cloud of the area
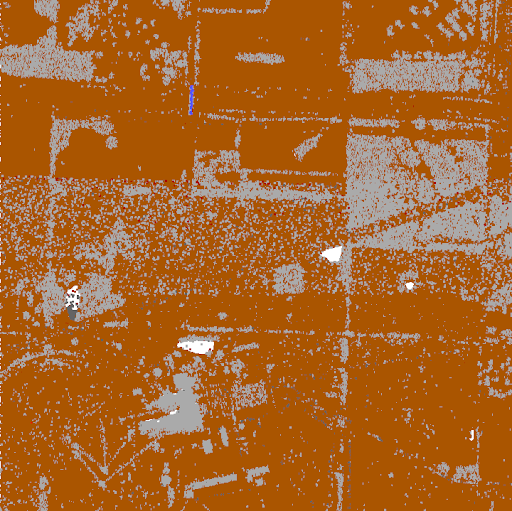
In this image of the point cloud, the coal pile is located on the bottom left underneath the v-shaped gray lines which are the conveyor belts. I then used QGIS to develop a Digital Elevation Model and added a pseudocolor ramp for elevation in addition to some contour lines to emphasize the location being studied. The coal pile is apparent in the image, showing up where the bright yellow color is in the bottom left.
Legend
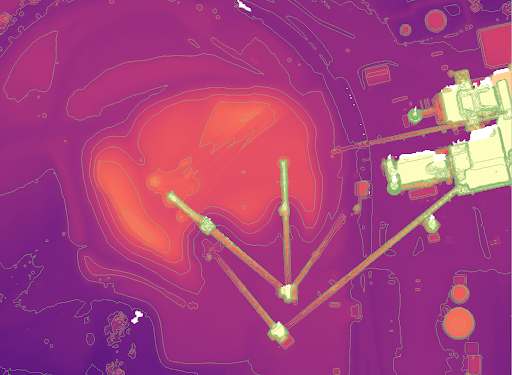
Digital Elevation Model classified by elevation
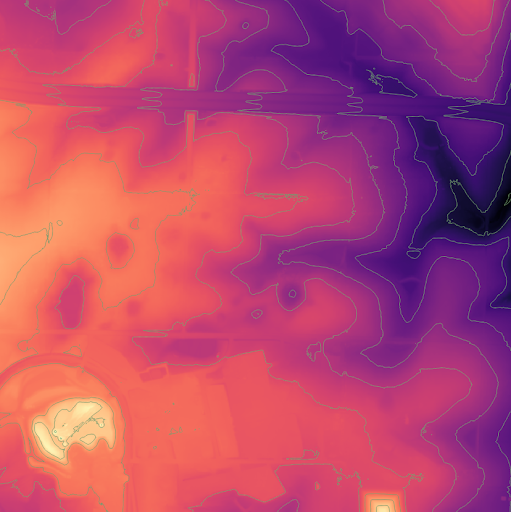
After this, I would be able to focus down to the specific part of the image of the coal pile and regenerate the DEM with higher accuracy. Although I have narrowed down specifically to the pile, there will likely still be some interference in the data from the conveyor belts over the top of the pile.
Closer view of the DEM
At this point, now all that is left to do is perform the raster surface volume analysis which will find the volume which is above a base elevation. To find this base elevation, I compared the base map of the area to the refined DEM. The value of the elevation at the start of the pile would be the value used in this calculation. The calculation ran and the results are shown below.
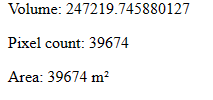
Raster Surface Volume Analysis results
The volume of coal in the pile was determined to be about 247220 m3, over an area of almost 40000 m2. With a resolution of 1 meter for this model, the pixel count and area should be the same. This volume is the equivalent of about 100 olympic sized swimming pools (2500 m3 each). The weight of the coal can also be determined using its known density. The density can vary between 1100 and 1500 kilograms per cubic meter, but for the sake of simplicity the density used in this calculation will be 1300 kilograms per m3. Multiplying the volume by the density yields the weight: 320 million kilograms. This is the equivalent of about 700 million pounds. That is a lot of coal.
There are many potential sources of error in this experiment. The first I observed earlier when the DEM was first generated. The conveyor belts over the top of the coal pile are above the starting elevation from the volume calculation, so their volume was included in the final volume number. Another source of error could be from a misjudgement of the starting elevation of the coal pile, or if the elevation underneath the coal pile was uneven. A third source of error, and one that can be included in most studies like this, is resolution limitations. A 1 meter resolution is likely good enough for a rough calculation like this, but a more accurate assessment would require a finer resolution or mesh generation.
It is clear that a more precise measurement could be found with better data or more complex methods, but for a general estimate of how much volume is in an area this was adequate. This method was relatively quick and easy. It can be applied to many other situations like volume of water in a flooded area or volume of snow added to mountains.
The result that was determined is a very large number, but it is not unlikely. Seeing the coal reserves myself from a few hundred feet up gave some much needed perspective on how much is really there. With the rise of sustainability within City Utilities, its slow shrinkage would be something to look forward to in the coming years.